Dashboard gives an overview of the systems. Getting started Section, allows you to navigate to different sections on a single click.
Usage Statistics shows the Controller or Super Admin the current usage of the system and system resources allocated as per the plan. It displays number of Users, Storage, Entities and Things that have been created and in use allowed under the plan.
API stats, it displays the total number of API calls made or received by their system versus the total limit of API calls allowed under the plan. The successful API calls will be displayed in green with thumbs up icon and failed API calls will be shown up with red thumbs down icon.
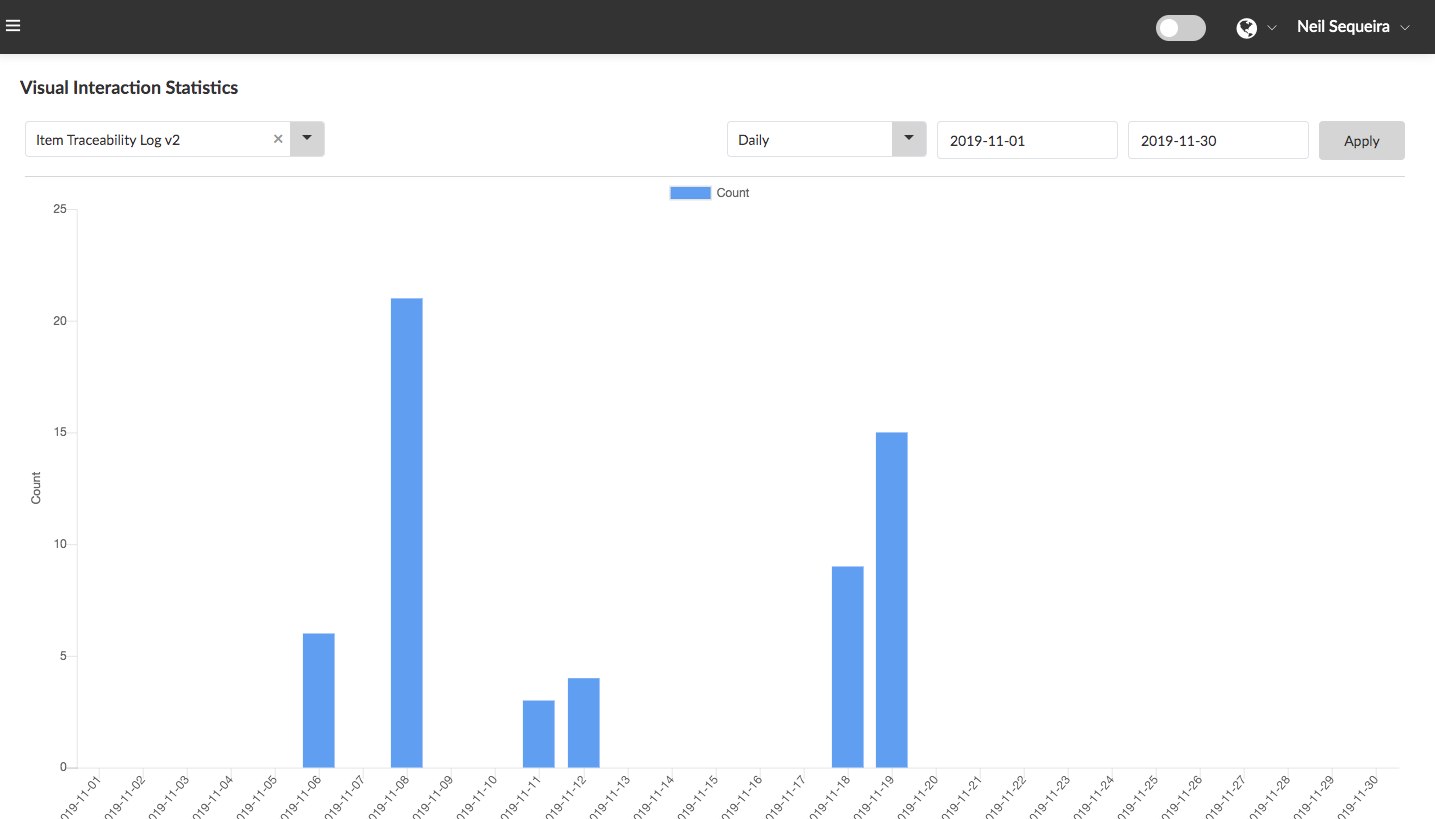
Visual Interaction Statistics drop down will display Digital Interaction Template for which you want to view statistics, select the count of Digital Interactions Daily, Monthly or Yearly and select a data range by selecting the start date and end date. Based on the selection the graph will display the number of active Digital Interactions / Count / Scans for that template.


